
This is the first blog post in our series, "Behind the SnapStream Monitoring & Compliance Feature."
"With SnapStream, instead of broadcast engineers having to manually look for the loudness problems, the problems will come and find them." — SnapStream developer Paul Place
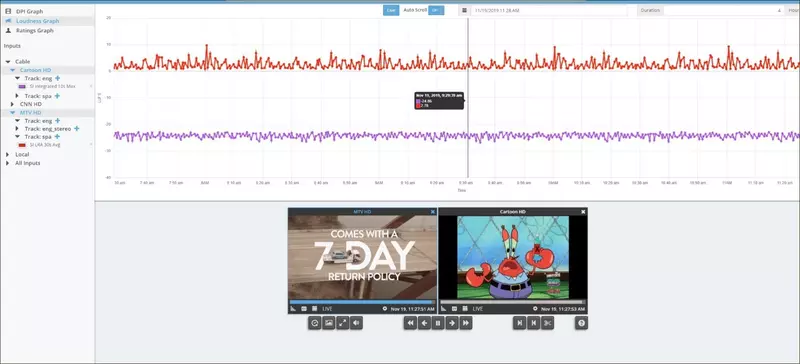 . The loudness graph in SnapStream Monitoring & Compliance.
Key Takeaways
1) When they were building the loudness feature in SnapStream Monitoring & Compliance, developers Paul Place and Tim Parker had extensive conversations with Volicon users.
2) During those conversations, they learned the major pain points Volicon users had with the product—such as having to manually look at the loudness graph daily.
3) In turn, they built a solution with an emphasis on exception based monitoring.
When they were building the loudness feature in SnapStream Monitoring & Compliance, developers Paul Place and Tim Parker spoke to multiple prospective customers. They dug into what in Volicon worked for them, and what didn’t—so they could make loudness monitoring in our own product comprehensive and user-friendly.
They recently discussed their journey developing the loudness feature.
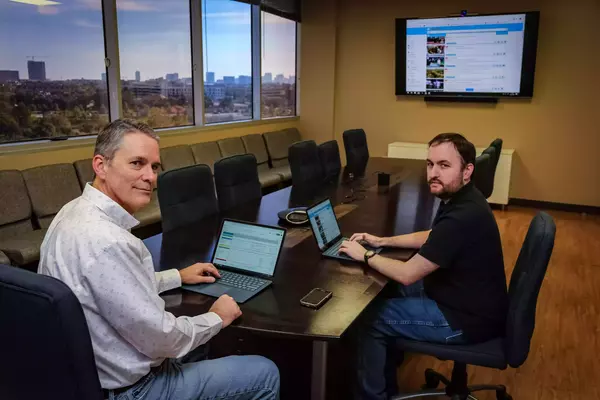
SnapStream developers Paul Place (left) and Tim Parker (right).
SnapStream: What research went into building SnapStream Monitoring & Compliance’s loudness monitoring features?
Tim Parker: We started with Volicon. We took a look at was in the Volicon UI, and that gave us a bunch of hints on where we needed to start our research.
When you open up the Volicon UI, you see things like ITU-R BS.1770 mentioned, or ATSC mentioned. Once you start looking at one of those documents, you realize there's a chain of documents that fit together. For the United States, it starts with the CALM Act, which then points to ATSC A/85 RP, which then points to the ITU-R BS. 1770 reference.
We spent time doing extensive research on loudness specifications and how loudness is computed. We did it this way because we didn't just want to follow what others had done without knowing how and why it worked. We wanted a deep knowledge of what loudness really is so we knew that the product we planned to build would work the way our customers expect.
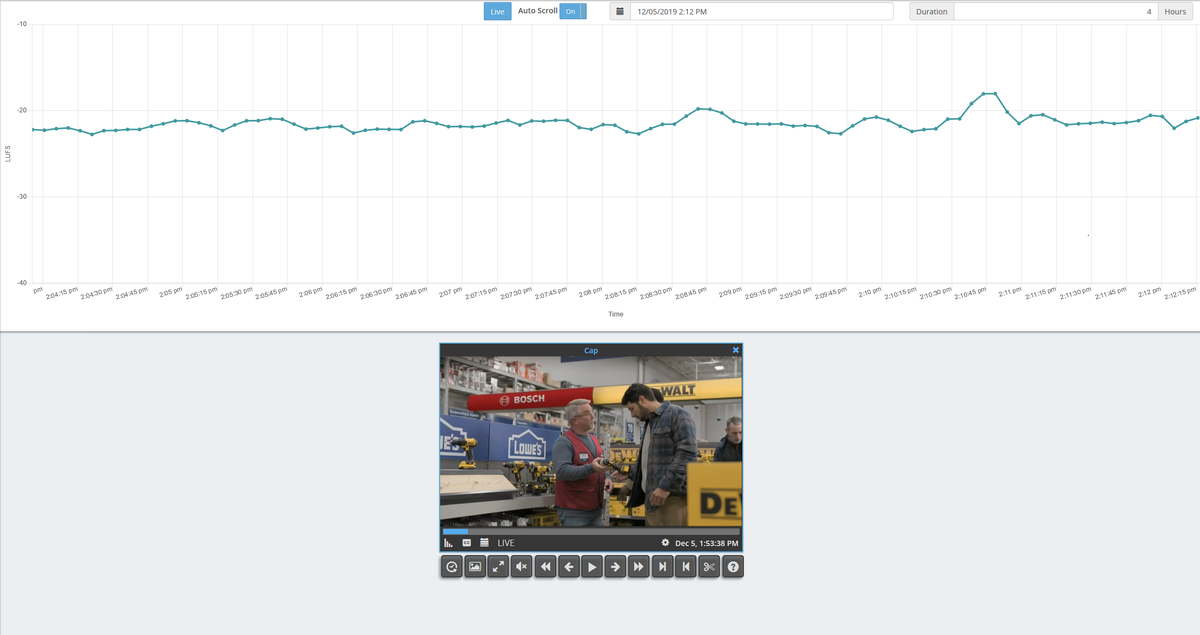
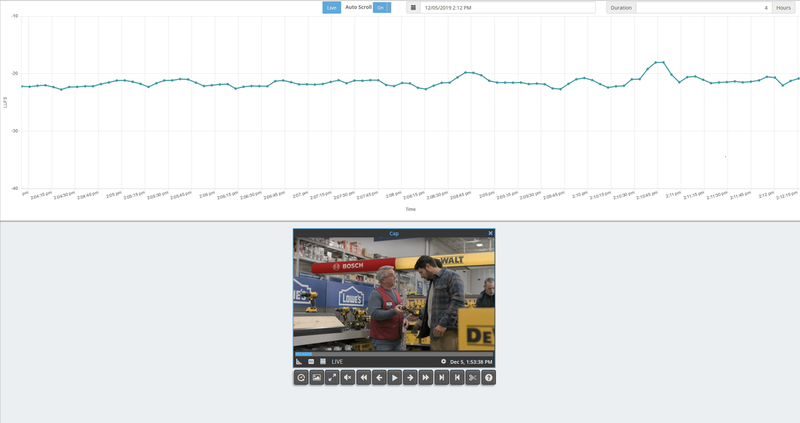
You can easily look for loudness peaks in SnapStream Monitoring & Compliance's loudness graph.
What insights did you gain from the conversations you had with Volicon customers?
Paul Place: We focused a lot on how they were using Volicon. The Volicon UI is kind of confusing because there's a number of things they present that aren't in the standard. Were customers using short interval computations, for example? What are they, why do customers care? Volicon also has long interval integrated value computations. What are they, why do customers care?
Interacting with customers and understanding their workflows helped us understand these features and pinpoint what was actually useful for them.
For example, we put the short interval values into our product because it made sense to us—they allow the customer to do things like select the end of a program segment and figure out what the integrated loudness is for just that commercial.
In other words, one of the biggest use cases for our customers is: is something too loud? The offender is usually a commercial.
What happened with Volicon is that they sort of accrued features over time—some of them more useful than others. There's a lot there that we couldn't find anybody using.
Parker: It's an interesting ecosystem because there's basically two layers at play here. There's the layer of automation that ensures the loudness is normalized before it goes to the customer's set top box.
And then we come in at the end of the chain, after it's been broadcast to the viewer. We're verifying that yes, this loudness is normalized. So when a viewer complains that something is loud, a broadcast engineer wants to analyze what went out to that viewer and see where it was loud.
That helps the broadcast engineer identify what part of that chain—before it went out to the viewer—is not working properly. Broadcast engineers have devices and software that make sure that loudness is normalized, but sometimes they get out of spec or they stop functioning properly. We're the last step in making sure that everything is working properly for them.
Clip export with burn-in of loudness data in SnapStream Monitoring & Compliance.
What were some major pain points Volicon users had that you both addressed?
Place: We started to see a pattern of these broadcast engineers being reactive. Volicon didn't really offer a good means of identifying program segments that were out of compliance. One broadcast engineer we spoke to would just scan and look at the peaks and valleys on the loudness graph. When he saw a peak, he would zoom in to see if there was a problem.
He had to go through this very manual process daily. Every single morning, he got in and he had a checklist of things to do. One of them was to look at the loudness graph for any problems.
We knew we could do better than that in SnapStream Monitoring & Compliance. We’re giving broadcast engineers automated tools for finding the loudness problems and alerting them. With SnapStream, instead of broadcast engineers having to manually look for the loudness problems, the problems will come and find them.
Volicon had an alerting system, but it was difficult enough to use that nobody we talked to used it, at least for loudness monitoring and compliance. Volicon users said they got a lot of alerts that they had to sift through to find the things they cared about. That made it not useful.
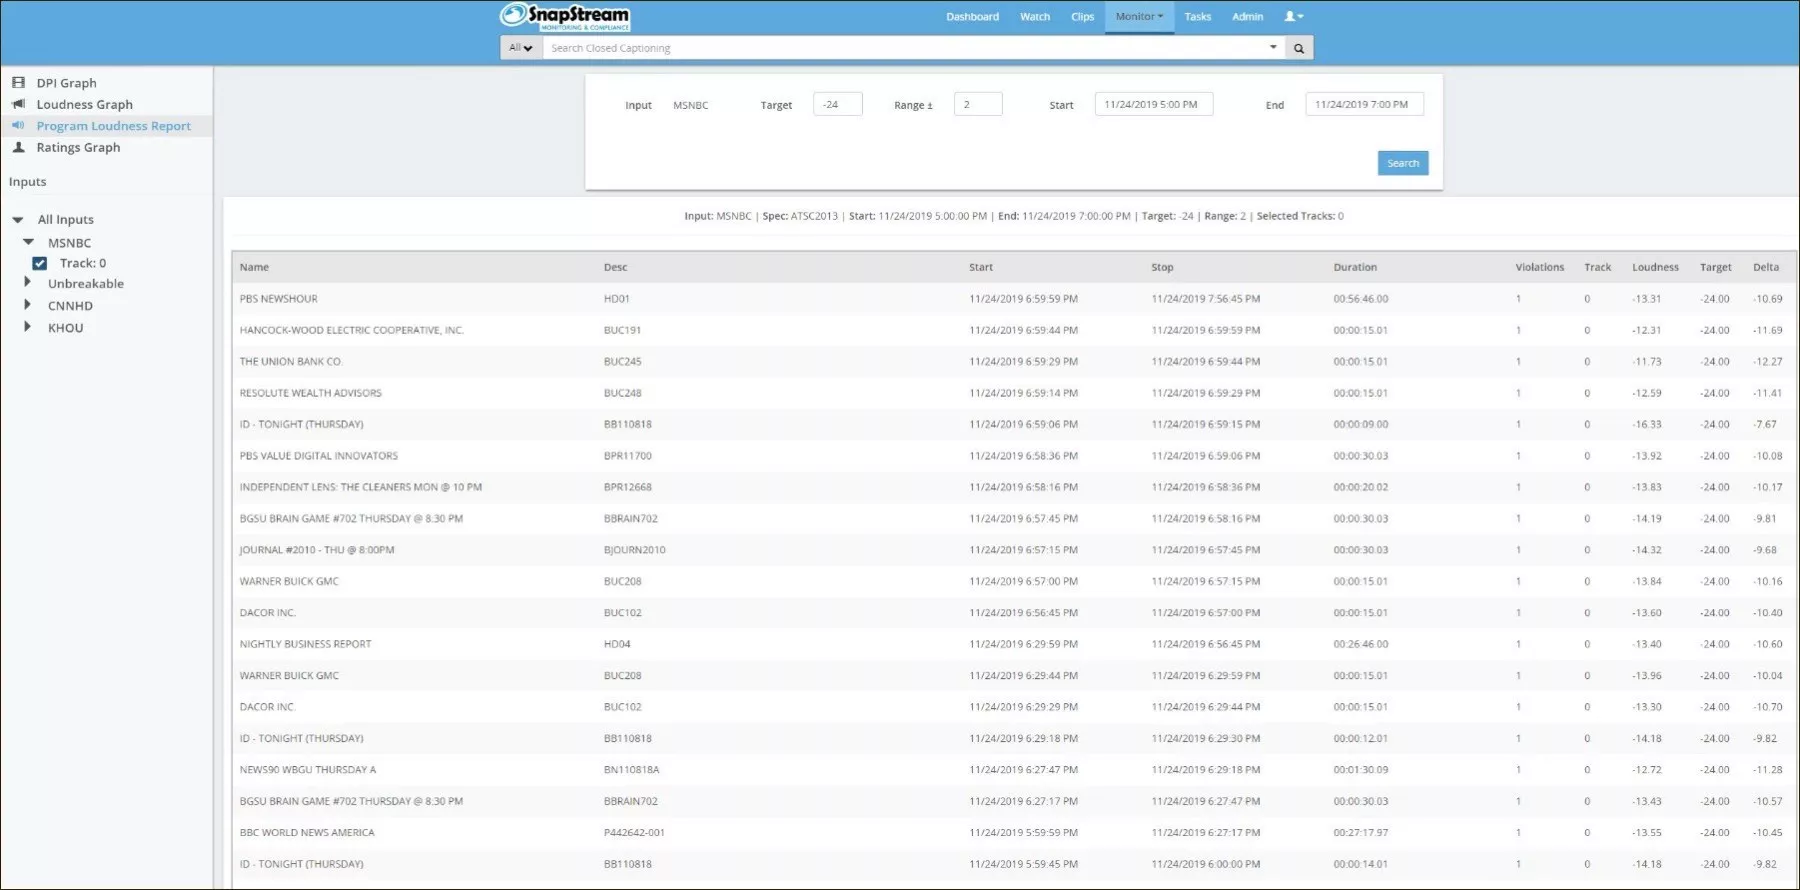
Loudness report in SnapStream Monitoring & Compliance.
SnapStream Monitoring & Compliance has a loudness graph and clip export with the option to burn-in loudness data. It also generates loudness reports. Could you give some more details on each?
Parker: I've seen screenshots of other loudness tools and they generally do just the report feature, or you get a spreadsheet with numbers essentially.
I think the way we present the loudness graph in the UI makes it easy for users to interact with and scrub the data—versus having a spreadsheet, which is limited in what it presents.
Place: I think the visual indicators are very useful. For example, looking for peaks on the loudness graph. Say you have a day’s worth of data. You can easily see if a part of your feed fell above the maximum loudness target, and then be able to drill down and learn more.
We’ve put a lot of engineering effort into making the loudness graph usable and responsive. You can zoom in and zoom out, for example.
Parker: The clip export with the option to burn-in loudness data gives broadcast engineers evidence they can send to someone—for instance, to a colleague, saying “Hey, you need to fix this. Here’s the data.”
And the goal of the loudness reports is to help users close to loop, so to speak. It’s a way for them to present proof to the FCC or another external stakeholder.
With SnapStream Monitoring & Compliance, you can monitor your feeds for regulatory compliance and advertising proof of performance. Our solution includes loudness monitoring, closed captioning verification, audio watermark detection, and more. SnapStream also offers tools for searching TV; sharing TV clips to Twitter, Facebook, and more; and sharing clips of live events to social media in real-time.